4. Heatmaps
Creating a heatmap
After creating and confirming a selection you can press the "create heatmap" button on the menu. The CellexalVR R package will calculate the 250 genes with the most varying expressions. The floor will start pulsing to show that the R scripts are being run in the background, and when it's done the heatmap will be shown. The genes that are returned by the R script are saved in a file located in Output/<username>/<dataset>/Heatmap.
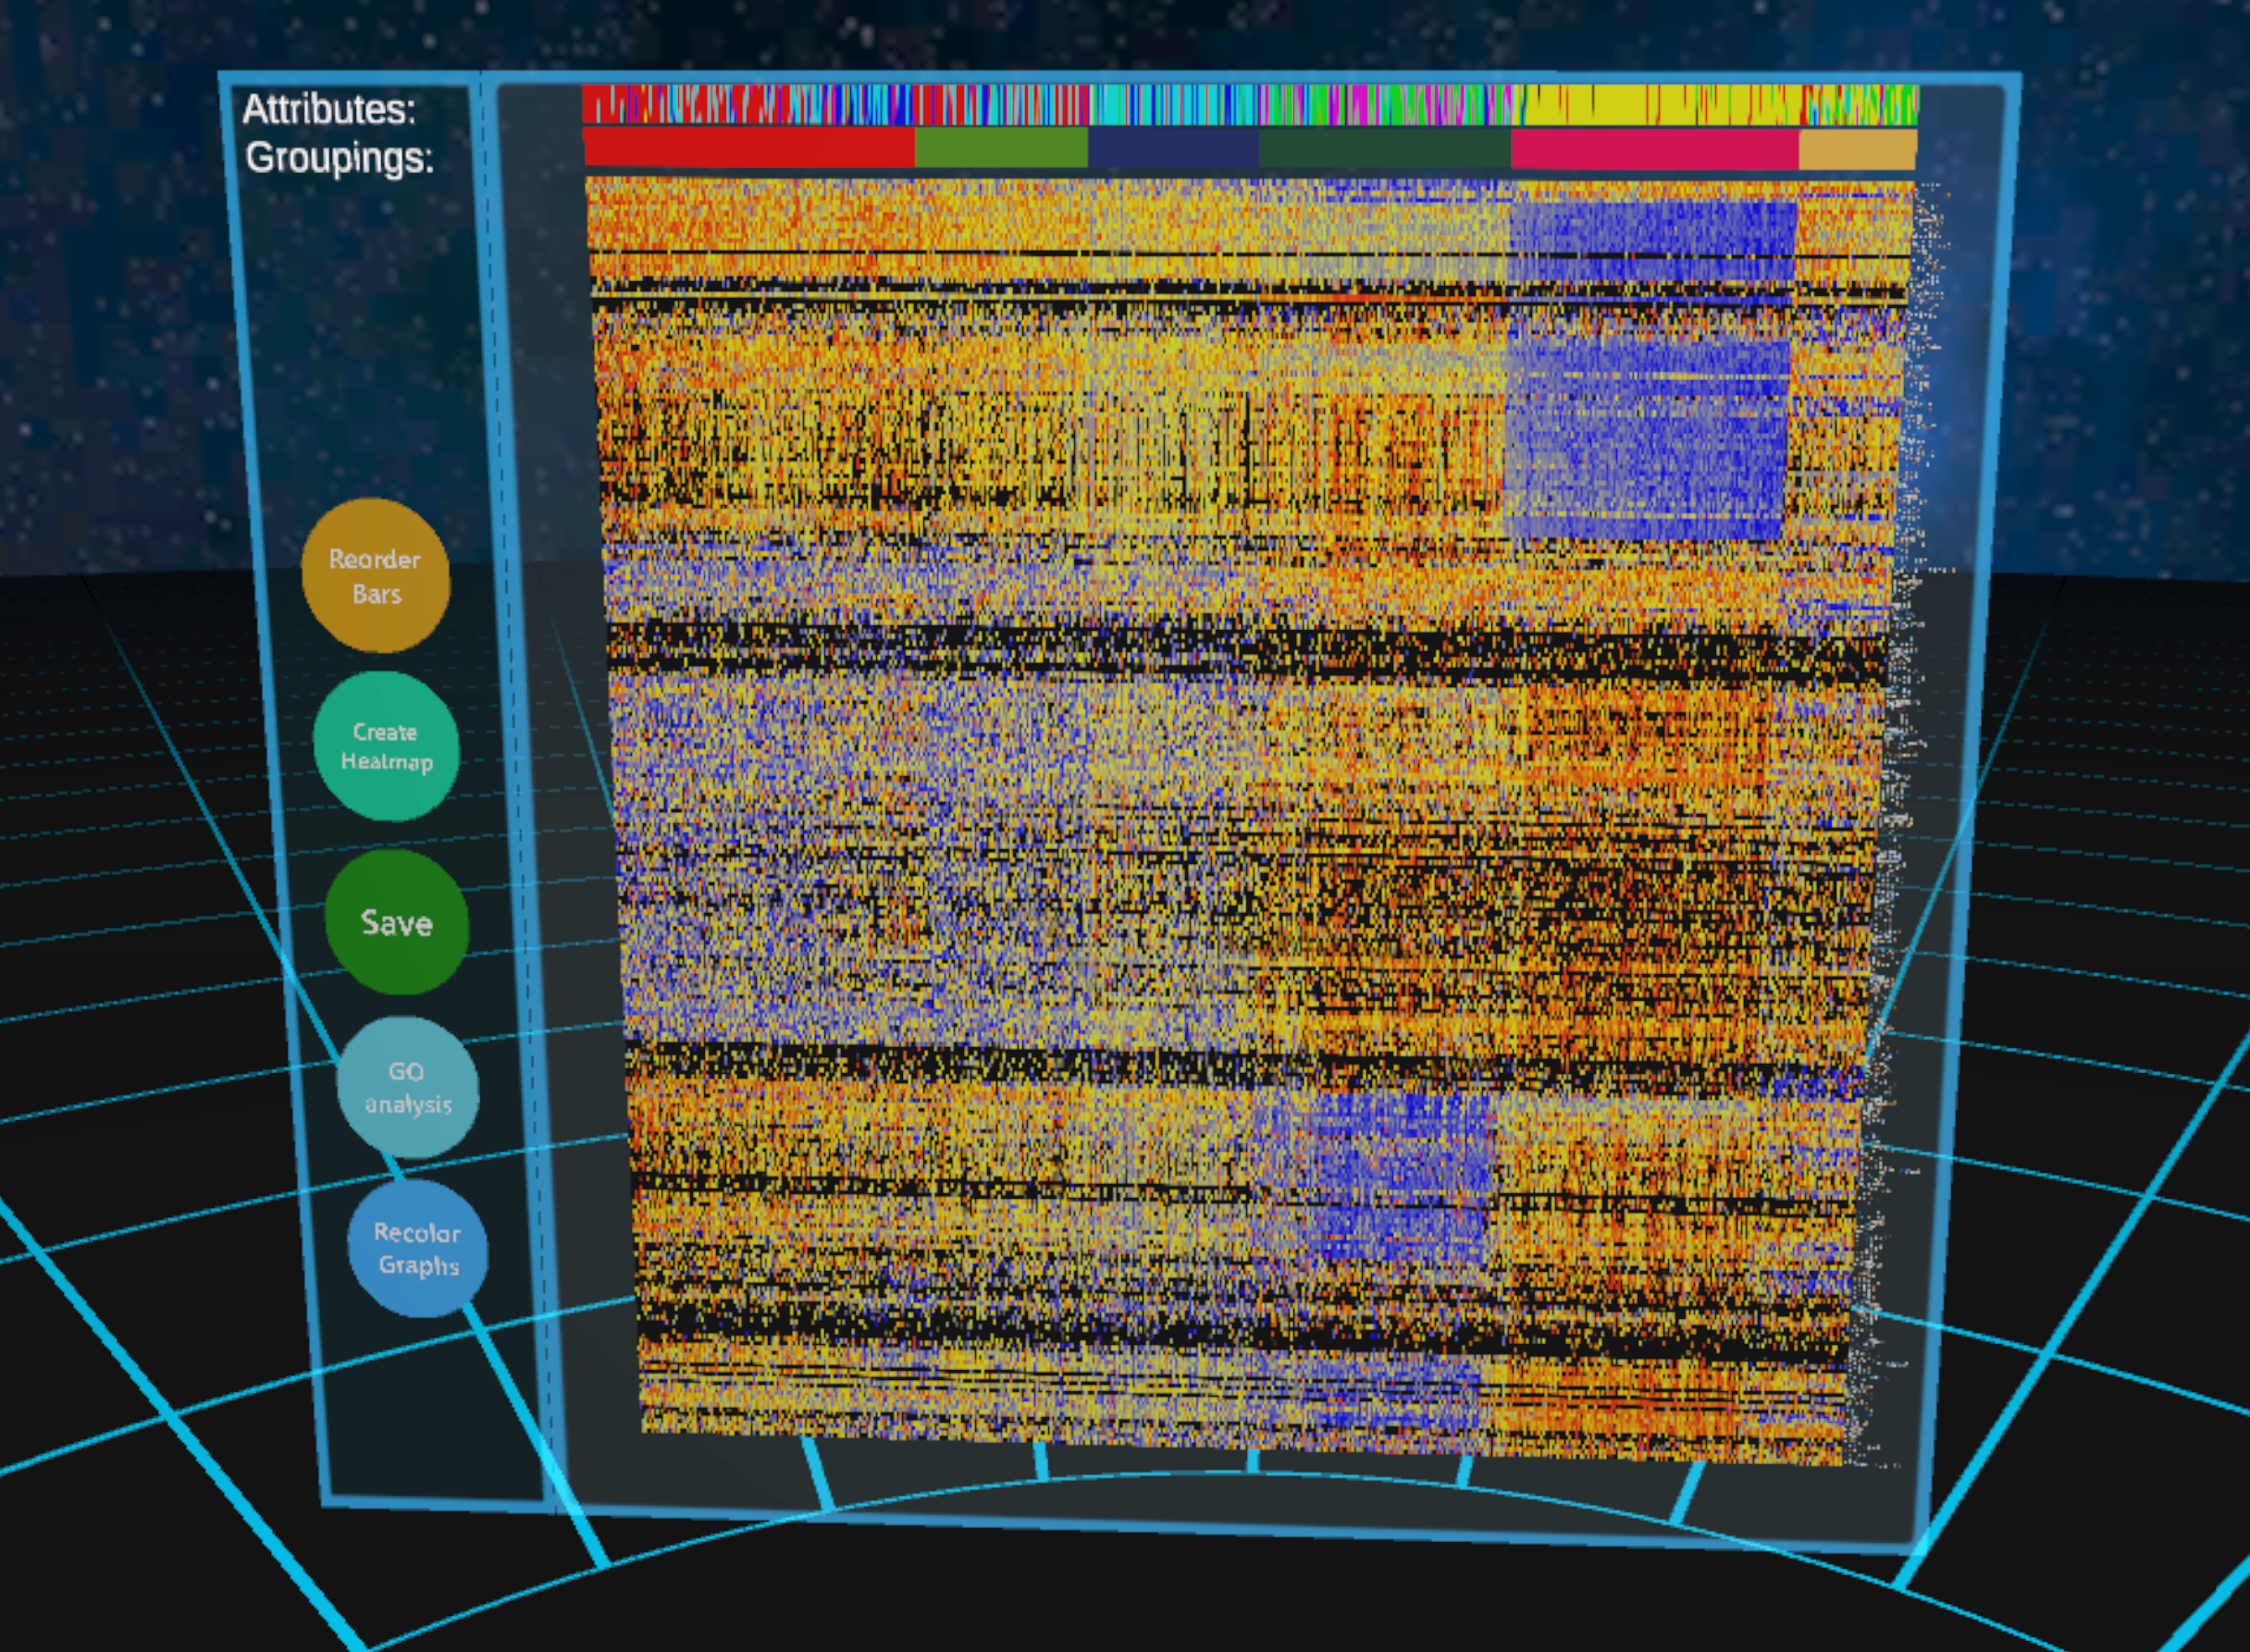
Each row of the heatmap represents a gene and each column represents a cell. Every element in the heatmap is colored based on the cells' expressions of the genes. The colors used are by default the same as when coloring graphs based on the expression of a single gene, but can be changed in the settings menu.
The colors are based on the highest and lowest expression of each gene, and each row's colors are chosen independently of each other, the color representing the highest expression will always be the highest expression of that gene in the cells included in the heatmap.
There are two coloured bars on top. The topmost shows you the attribute of the cell in that column. If a cell has multiple attributes it shows the first one in alphabetical order. The bar just below represent the cells' groups that they belong to (the color that you gave them with the selection tool). The cells are ordered from left to right in the order they were selected. This creates a pseudo time element to the heatmap. On the right side of the heatmap you can read the gene names. You can generate any number of heatmaps (make them small or hide them using the hide tool to reduce clutter).
By pointing the controller towards the heatmap the laser tool will activate and you can interact with the heatmap, read more about the specific features here.
If you want to remove a heatmap, use the delete tool.